


Explaining the algorithm
By Francisco Pascual Romero (Coordinator of the U. Master in Computer Engineering)
This week it is news that there have been, unfortunately, 26 deaths on Spanish roads. This improves the forecasts of Big Data, or rather of the artificial intelligence algorithms that make use of Big Data, which were 36.
Several questions arise from this prediction, first of all, an absolute figure is not normally predicted or forecast, the results of a prediction are usually somewhat more complex, for example, a degree of confidence of the figure is offered or in which interval it is more reliable that figure. A single number is good data for the audience but not really useful.
On the other hand, on many occasions the process of calculating the number is more valuable than the number itself. Presumably, variables such as the time series, meteorological circumstances, etc. have been taken into account to obtain that "36". Knowing the factors that influence the prediction is one of the most valuable elements that exist to help decision making.
Finally, there is the distortion of the prediction itself. When you predict something about some phenomenon you already affect it. This is something I learned from the teacher Jose Angel Olivas more than 20 years ago and it is still valid. For example, the DGT uses the figure to condition our behavior through an advertising campaign, trying to make us be more careful at the wheel. That is, the "big data" is used so that the "big data" does not get it right, since the important thing is not to get it right but to reduce the number of deaths on the road.
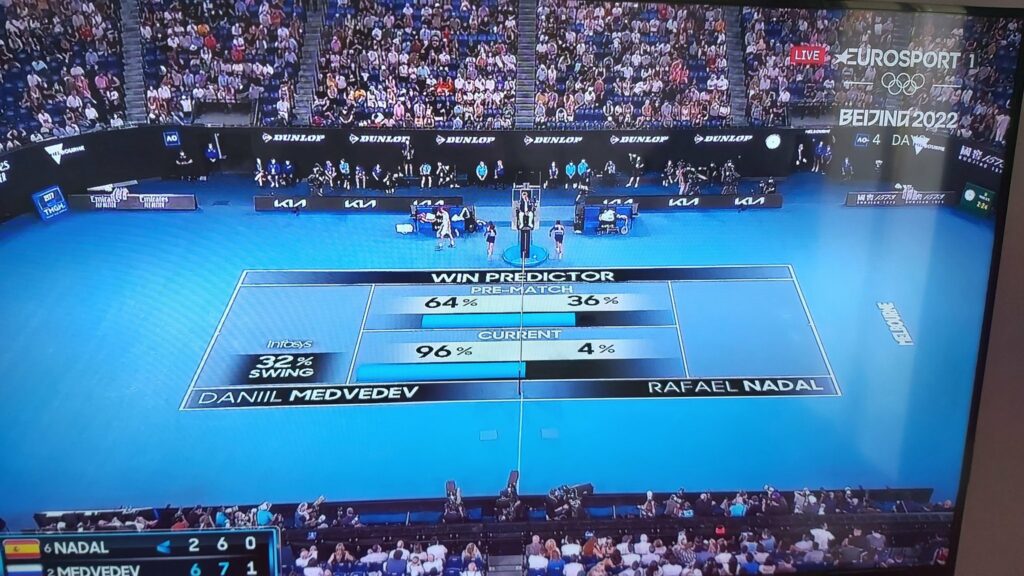
Another example: Nadal at the Australian Open.
Everyone saw the image of Nadal's 4% chance of victory against Medveveed in the final of the last Australian Open. Subsequent headlines resembled “Nadal Beats Big Data” etc. A few weeks later Marco Asensio scores a goal that, according to the model shown on television, had a 10% chance of being a goal. Subsequently, identical headlines, possibly what happens to us is that when we point to the moon we look at the finger and we do not realize what is behind those numbers.
Probability vs Possibility. A 4% probability indicates that Nadal's victory was possible and more so with the tennis scoring system. It is not an impossible event, it is rare, but it is not impossible. Let's stop for a moment, every December 21st we think that the next day he is going to win the lottery jackpot, and that with a probability of 0,001%, and we always consider it possible.
How does the model calculate that number? In the first place, an a priori probability is used in which Nadal had a 36% probability of winning the match. Normally these a priori models are based on the rankings (higher than Medveded's), past streaks, playing surface, last games, etc. Then there is the future of the party; Taking a simple model that analyzes similar historical situations, only in 4 of 100 matches to 5 sets had a result like the one been traced back. If we focus on Nadal, he had only come from 2 games out of 20 in that situation. So the number is justified, but does it give us enough information?
How do you get to that number? A figure is an instant, and valuing an instant we lose part of the story. Let's remember Heisenberg's Uncertainty Principle: if we value a variable very precisely, we are losing perspective of the rest. On the other hand, reaching that 4% from 1% is not the same as having dropped from 32%. And not only that, it is not only necessary to evaluate that number, but also how it evolved later during the match, and how different events such as saving a break ball or having a break above in the third set can greatly change that probability of victory. These events, knowing and analyzing them are the key in this analysis.
How can I change that probability? This is the useful part of the number, if you tell a player at a given moment that he has a 4% chance of victory you are not giving him anything new, he knows that by looking at the scoreboard. The important thing to contribute is what is happening in your game that is leading you to defeat and how you can change that dynamic. That is to say, the useful thing would be to say: “look Rafa, he is winning all the points you throw with the second serve, and you don't have any double faults, keep that in mind” or “of the services that he throws you the other way around you are losing 90% and with rallies of less than 3 balls”. This is something that can be useful to the player and the coach, that is the true usefulness of the application of these algorithms and models.
In conclusion, the isolated numbers are those numbers, but they need a context and a detailed analysis, there is no need for any “numerical” interpretation of them. Algorithms and models can provide much more information and relevant knowledge that allows you to understand behaviors and how to obtain better results.