

The MAT group of the ESI develops a website that allows visualizing and monitoring the progress of COVID-19
https://covid19.esi.uclm.es/
The University of Castilla-La Mancha (UCLM) launches another action initiative against the SARS-CoV-2 coronavirus. The Models and Algorithms for Transport Systems (MAT) research group of the Ciudad Real School of Informatics has created a website that allows visualizing and monitoring the progress of COVID-19 by country and, in the case of Spain, , by autonomous communities. The website offers daily data and predictions a week ahead of the number of cases, recoveries and deaths.
The group of Models and Algorithms for Transport Systems (MAT) of the Higher School of Computer Science of the University of Castilla-La Mancha (UCLM) in the Ciudad Real Campus has developed a page websites for the monitoring, centralization and visualization of data on the condition of COVID-19. The site, through the use of mathematical techniques, as well as data analysis and artificial intelligence, studies the evolution and expansion of the coronavirus with the aim of providing information to control the progress of the pandemic. These analytical techniques, according to the group led by the professor of the Department of Mathematics of the UCLM Ricardo Garcia Ródenas, "allow support for decision-making".
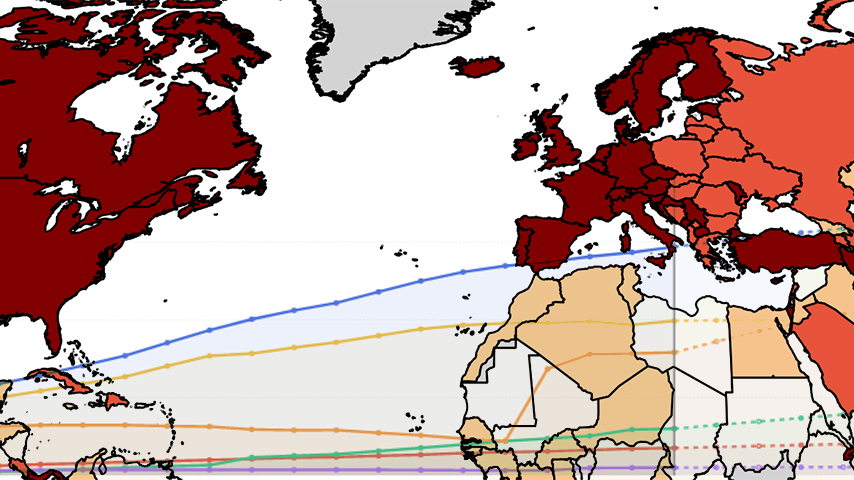
The website makes it possible to view a heat map, updated every day, in which the current status of the epidemic worldwide is observed, as well as the data on the condition of COVID-19 grouped by country and, in the case of Spain, The data grouped by Autonomous Community is also shown.
For each of the countries it is possible to view the number of total cases, active cases, deaths and recoveries. These data are updated daily and have been obtained from a public repository managed by the Johns Hopkins University Center for Systems Science and Engineering (JHU CSSE) and supported by the ESRI Living Atlas Team and the Johns Hopkins University Applied Physics Lab (JHU APL) . In addition, it also offers a one-week prediction of the number of new cases, recoveries and deaths.
Similarly, the website shows the evolution of the virus at the level of autonomous communities in Spain. The data is updated daily from that supplied by the Carlos III Health Institute in Madrid, which, in turn, is used by the Ministry of Health. Thus, for each of the autonomous communities, the number of total cases, active cases, deaths and recoveries is shown, as well as the number of patients hospitalized and admitted to the ICU. Likewise, it is possible to visualize a prediction a week ahead of the number of new cases, recoveries and deaths by region.
Finally, both by country and by Spanish autonomous community, the website shows the evolution of the SARS-CoV-2 contagion rate over time, along with a prediction a week ahead, allowing it to be compared with a break-even point with the objective of clarifying whether a country or a specific autonomous community is in a moment of expansion or contraction of the epidemic. All this, the researchers report, "with the aim of monitoring the status of the epidemic and providing information and knowledge to the authorities who work hard every day to reduce its effects."
This initiative joins many others carried out from different centers and departments of the UCLM in the face of the health emergency situation caused by the SARS-CoV-2 coronavirus.
Source: UCLM Communication Office. Royal City, April 16, 2020